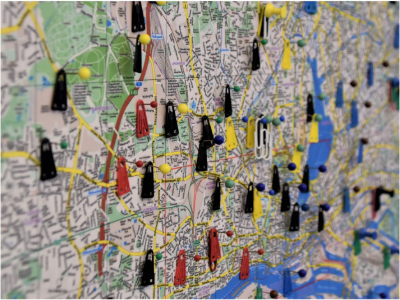
This module introduces methods to create simple maps without the use of GIS or cartography software. We can use common software (e.g. Excel or PowerPoint) to develop visualisations that can then be shared in reports, bulletins or online. In this module we look at how to use Power Point to create a map.
Learning objectives
By the end of this module, you will be able to:
- Explain how to make a non-GIS map;
- List sources of data to create simple maps; and
- Create a map using assessment data.
Audience
This module is an introductory-level course aimed at anyone who is interested in developing skills and knowledge in nutrition information management in humanitarian contexts, and who needs to engage with coordination and humanitarian architecture on this topic. It is part of the recommended learning path for sub-national IMOs aiming to progress to national-level roles.
Length
It should take you about 16 minutes to complete this self-paced course.
Methodology
This course is composed of a single short self-paced animated module, including various examples and activities.
Structure
Introduction
Lesson 1: Using PowerPoint for making maps
8 mins
Lesson 2: Steps for creating simple maps
8 mins
Summary
Contact details
For technical issues, you can contact https://www.nutritioncluster.net/Ask_question
